How to Build Technical Indicators to Predict the Stock Market using AI
Why Predicting the Stock Market is Challenging
Predicting the stock market is challenging due to the multitude of influencing factors, including geopolitical events, company earnings, and market emotions. Each individual’s reaction to information varies, adding complexity to predictions.
The Efficient Market Hypothesis suggests all information is already priced in, making consistent outperformance seem improbable. However, numerous traders and investors have successfully and consistently beaten the market, demonstrating that with the right approach, such predictions are possible.
Understanding Technical Indicators
What are Technical Indicators?
Technical indicators are mathematical calculations based on a stock’s price, volume, or open interest, used to forecast future price movements. They help traders identify trends, potential entry and exit points, and overall market conditions by analyzing historical data. Technical indicators are integral to technical analysis, enabling investors to make informed decisions.
Commonly Used Technical Indicators
- Relative Strength Index (RSI): Measures the speed and change of price movements to identify overbought or oversold conditions. Values above 70 suggest overbought conditions, while below 30 indicates oversold.
- Moving Averages: Smooth out price data to identify trends over a specific period. The Simple Moving Average (SMA) and Exponential Moving Average (EMA) are the most commonly used.
- Bollinger Bands: Consist of a middle band (SMA) and two outer bands that represent standard deviations. They help identify volatility and potential price reversals when the price moves outside the bands.
Does technical indicators really work
Yes, technical indicators are widely used by successful traders, including notable figures like Michael Marcus, who rely heavily on them (source: Market Wizards Book by Jack D. Schwager).
The effectiveness of technical indicators can be attributed in part to the self-fulfilling prophecy: when a large number of traders use the same indicators, their collective actions based on these signals can influence market movements, thereby validating the indicators’ predictions.
Building Technical Indicators Using Python
Setting Up Your Environment
To start, you need to install the required libraries if you haven’t already:
pip install pandas mplfinance yfinance
Creating Basic Technical Indicators
Let’s create a basic technical indicator: the Relative Strength Index (RSI). RSI is a momentum oscillator that measures the speed and change of price movements.
Here’s how you can calculate RSI 14 periods using Python:
import pandas as pd
import yfinance as yf

# Function to calculate the RSI
def calculate_rsi(data, window=14):
    # Calculate the difference in price from the previous step
    delta = data['Close'].diff()

    # Separate gains and losses
    gain = (delta.where(delta > 0, 0)).rolling(window=window).mean()
    loss = (-delta.where(delta < 0, 0)).rolling(window=window).mean()

    # Calculate the RSI
    rs = gain / loss
    rsi = 100 - (100 / (1 + rs))

    return rsi

# Fetch historical data
ticker = 'AAPL'
data = yf.download(ticker, start='2023-01-01', end='2024-01-01')

# Calculate RSI
data['RSI'] = calculate_rsi(data)
Now let’s add a simple 20 period moving average:
data['SMA'] = data['Close'].rolling(window=20).mean()
Visualizing Technical Indicators
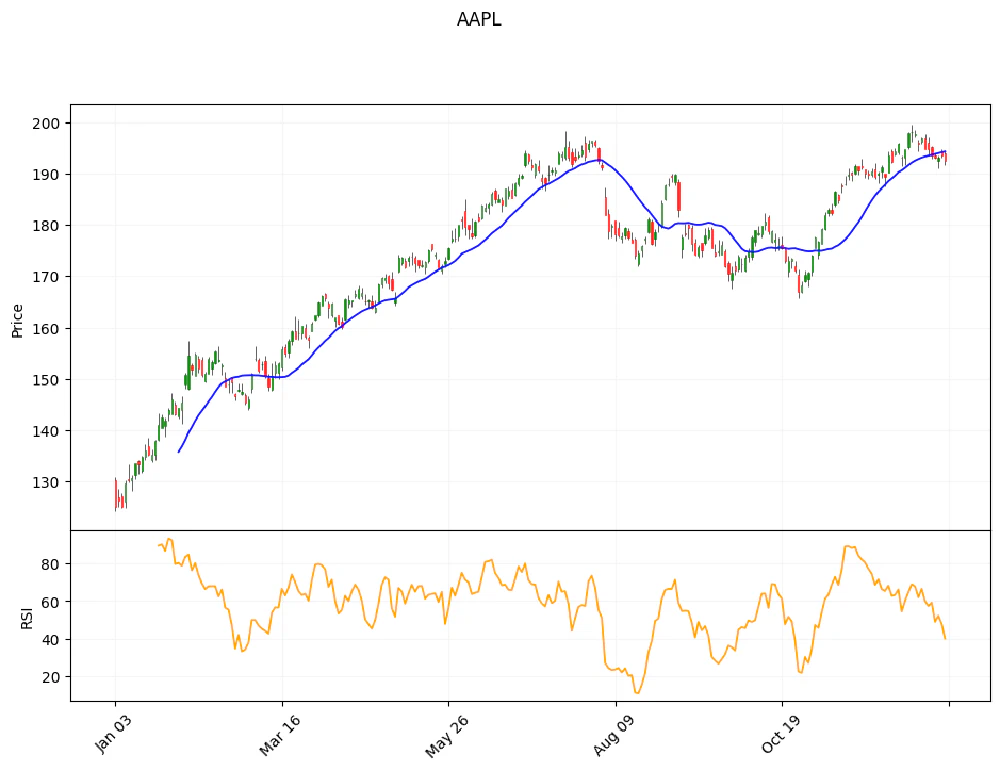
To visualize the RSI, the simple moving average along with the stock price, we’ll use mplfinance. This will allow us to plot the price and the RSI on separate subplots.
import mplfinance as mpf

CHART_STYLE  = mpf.make_mpf_style(
    marketcolors=mpf.make_marketcolors(up='green',down='red', edge={'up':'green','down':'red'}, ohlc='black'),
    gridstyle='-', gridcolor='#F5F5F5'
)

mpf.plot(
    data, type='candle', style=CHART_STYLE, title=ticker, ylabel='Price',
    figsize=(12, 8), volume=False,
    addplot=[
        mpf.make_addplot(data['SMA'], panel=0, color='blue', secondary_y=False),

        mpf.make_addplot(data['RSI'], panel=1, color='orange', ylabel='RSI')
    ]
)

How to Build Advanced Technical Indicators to Predict the Stock Market Using Machine Learning
At ML Alpha, we harness the power of supervised learning algorithms such as XGBoost, Random Forest, and LightGBM to identify stocks poised to outperform the market. These algorithms are widely used in popular stock market competitions, including Numerai and Kaggle, due to their robust performance with smaller datasets and their ability to handle complex data while capturing intricate patterns without overfitting. Unlike deep learning models, which often require vast amounts of data and computational resources, these algorithms are more efficient and effective for our needs. We will dig deeper into the rationale behind selecting these algorithms over deep learning approaches in a separate article.
Why Simple Indicators Aren’t Enough
As we’ve shown previously, simple indicators like the Relative Strength Index (RSI) and Simple Moving Average (SMA) are useful, but they don’t provide enough information for machine learning models to accurately predict market movements. To enhance predictive accuracy, we need to derive more sophisticated features from these basic indicators.
Using Advanced Technical Indicators to Enhance Machine Learning Predictions
While basic technical indicators provide useful insights, they are often insufficient for significantly improving our machine learning predictions. To gain a more comprehensive understanding, it is crucial to analyze the market context across different stocks. Like a skilled investor or trader, our approach must consider the current market phase—whether it is trending upward, downward, or remaining stationary.
Relying solely on absolute numbers does not allow a machine learning algorithm to effectively interpret these phases. Although including lagged values might enable a supervised learning model to identify market patterns, it can make the learning process more complex and time-consuming. To address this, we can create derivative values from existing technical indicators, making it easier for our models to discern market trends.
In this example, we will explore three advanced derivatives:
Stock Price Relative Position Compared to the Moving Average: This indicator shows how a stock’s price compares to its moving average, providing insights into whether the stock is overbought or oversold.
Slope of the RSI and SMA Curves: By analyzing the inclination of the Relative Strength Index (RSI) and Simple Moving Average (SMA) curves, we can gauge the momentum and strength of market trends.
Comparison with the S&P 500 Metrics: Comparing stock-specific metrics to those of the S&P 500 allows us to contextualize a stock’s performance relative to the broader market.
These are just a few examples of the derivative indicators we can utilize. Including lagged values or calculating percentage changes over specified periods can also be beneficial. However, to keep this article concise, we will focus on the three points mentioned above.
Implementing Advanced Technical Indicators for Machine Learning in Python
1. Stock Price Relative Position Compared to the Moving Average
The relative position can help determine if the stock is overbought or oversold in relation to its moving average.
def calculate_relative_position(data, window=20):
    """Calculate the stock price relative position to the SMA"""
    sma = data['Close'].rolling(window=window).mean()
    return (data['Close'] - sma) / sma

data['SMA_Price_position'] = calculate_relative_position(data)
2. Slope of SMA and RSI
The slope of these indicators can provide insight into the momentum and trend strength.
def calculate_slope(series, window=5):
    """Calculate the slope of a given series"""
    return series.diff().rolling(window=window).mean()

data['SMA_Slope'] = calculate_slope(data['SMA'])
data['RSI_Slope'] = calculate_slope(data['RSI'])
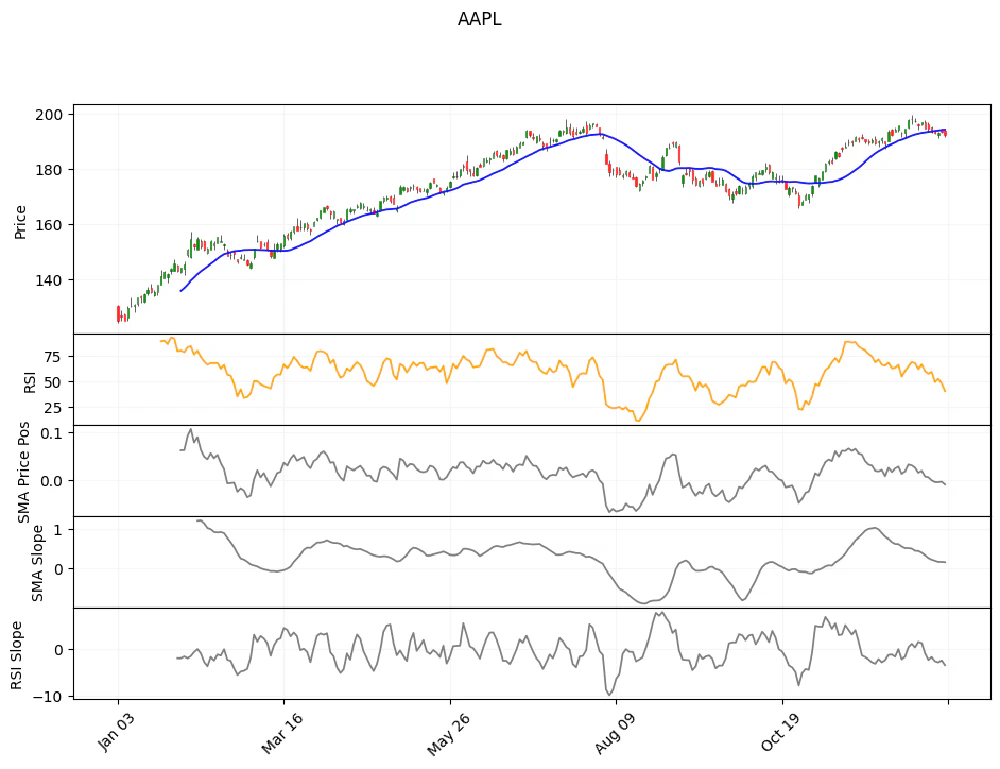
Let’s plot our data so far:
mpf.plot(
    data, type='candle', style=CHART_STYLE, title=ticker, ylabel='Price',
    figsize=(12, 8), volume=False,
    addplot=[
        mpf.make_addplot(data['SMA'], panel=0, color='blue', secondary_y=False),

        mpf.make_addplot(data['RSI'], panel=1, color='orange', ylabel='RSI'),

        mpf.make_addplot(data['SMA_Price_position'], panel=2, color='grey', ylabel='SMA Price Pos'),
        mpf.make_addplot(data['SMA_Slope'], panel=3, color='grey', ylabel='SMA Slope'),
        mpf.make_addplot(data['RSI_Slope'], panel=4, color='grey', ylabel='RSI Slope')
    ]
)

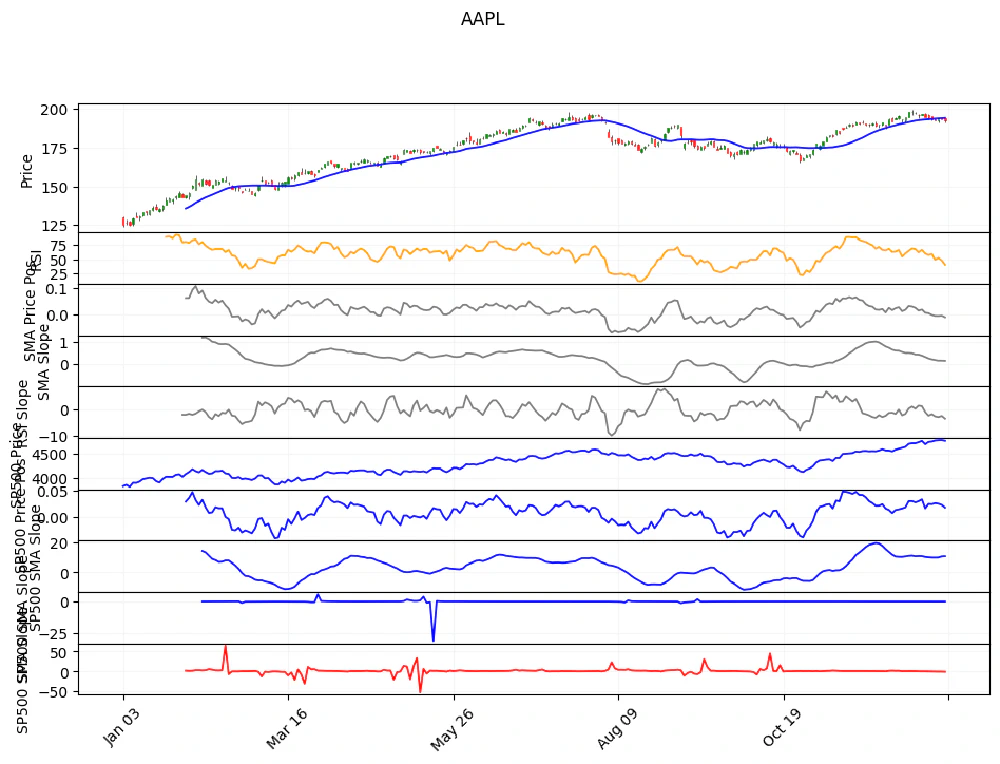
3. Compare Position and Slope of Price SMA with SP500 SMA
Comparing the stock’s performance with a broader index like the S&P 500 provides context for its movements.
# Fetch SP500 data
sp500 = yf.download('^GSPC', start='2023-01-01', end='2024-01-01')
sp500['SMA'] = sp500['Close'].rolling(window=20).mean()
sp500['SMA_Slope'] = calculate_slope(sp500['SMA'])
sp500['SMA_Price_position'] = calculate_relative_position(sp500)

data['SP500_Close'] = sp500['Close']
data['SP500_SMA_Price_position'] = sp500['SMA_Price_position']
data['SP500_SMA_Slope'] = sp500['SMA_Slope']
data['SP500_SMA_Slope_vs_stock'] = data['SMA_Slope'] / sp500['SMA_Slope']
data['SP500_Price_Pos_vs_stock'] = data['SMA_Price_position'] / data['SP500_SMA_Price_position']


mpf.plot(
    data, type='candle', style=CHART_STYLE, title=ticker, ylabel='Price',
    figsize=(12, 8), volume=False,
    addplot=[
        mpf.make_addplot(data['SMA'], panel=0, color='blue', secondary_y=False),

        mpf.make_addplot(data['RSI'], panel=1, color='orange', ylabel='RSI'),

        # Price Augmented features
        mpf.make_addplot(data['SMA_Price_position'], panel=2, color='grey', ylabel='SMA Price Pos'),
        mpf.make_addplot(data['SMA_Slope'], panel=3, color='grey', ylabel='SMA Slope'),
        mpf.make_addplot(data['RSI_Slope'], panel=4, color='grey', ylabel='RSI Slope'),

        # Compared to the sp500
        mpf.make_addplot(data['SP500_Close'], panel=5, color='blue', ylabel='SP500 Price'),
        mpf.make_addplot(data['SP500_SMA_Price_position'], panel=6, color='blue', ylabel='SP500 Price Pos'),
        mpf.make_addplot(data['SP500_SMA_Slope'], panel=7, color='blue', ylabel='SP500 SMA Slope'),
        mpf.make_addplot(data['SP500_SMA_Slope_vs_stock'], panel=8, color='blue', ylabel='SP500 SMA Slope'),
        mpf.make_addplot(data['SP500_Price_Pos_vs_stock'], panel=9, color='red', ylabel='SP500 SMA Slope'),
    ]
)

Insights from our ML Alpha Machine Learning Datasets
At ML Alpha, we’ve dedicated extensive time and effort to fine-tuning our technical indicator derivatives, ensuring that they deliver the most accurate insights and have been validated through our machine learning models. Our insights are drawn from a wide array of technical indicators, far beyond just the Simple Moving Average (SMA) and Relative Strength Index (RSI). In fact, we employ over 30 different indicators, each with even more complex derivatives.
For data scientists interested in leveraging these insights, we offer access to our Machine learning Dataset. This comprehensive dataset includes over 400 curated technical indicator derivatives, as well as more than 250 fundamental features designed to aid in predicting winning stocks.
Conclusion
Building effective machine learning features for stock market prediction is a complex task that requires a combination of trading experience and technical expertise in machine learning and backtesting. While experience in trading and investing provides valuable insights, it must be complemented by a deep understanding of machine learning algorithms and rigorous backtesting methods. In upcoming articles, we’ll delve into these topics to provide a more comprehensive guide, so stay tuned!
At ML Alpha, we are committed to constantly enhancing our feature sets and providing cutting-edge stock market analysis. Our vision is to create the premier investing insights platform powered by AI and stock market experts, offering any investors the best track record proven insights.
We value feedback and insights from our users as we continue to grow and innovate. Join ML Alpha for free today and be a part of our community!
